
Prometheus metrics
ResticGUI can serve Prometheus metrics at /metrics. It is off by default; turn it on in the configuration:
metrics:
  enabled: true
  # when set, scrapes must send "Authorization: Bearer <token>"
  token: "a long random string"
/metrics is outside the login of the web interface, so set a token whenever the server is reachable by others. A scrape configuration:
scrape_configs:
  - job_name: resticgui
    authorization:
      credentials: a long random string
    static_configs:
      - targets: ["resticgui.example.com:3001"]
A scrape reads ResticGUI's database only; it never runs restic. The repository size and snapshot count are refreshed after each successful backup, cleanup or init.
Metrics
| Metric | Labels | Meaning |
|---|---|---|
resticgui_repository_info | repository, backend | Always 1, one per repository |
resticgui_repository_size_bytes | repository | Size of the data in the repository |
resticgui_repository_snapshots | repository | Number of snapshots |
resticgui_job_last_run_timestamp_seconds | repository, kind | When the last job of this kind finished |
resticgui_job_last_run_success | repository, kind | 1 when it succeeded, 0 otherwise |
resticgui_job_last_success_timestamp_seconds | repository, kind | When the last successful job of this kind finished |
resticgui_backup_last_duration_seconds | repository | How long the last successful backup took |
resticgui_backup_last_added_bytes | repository | Data the last successful backup added |
resticgui_backup_last_processed_bytes | repository | Data the last successful backup read |
resticgui_backup_last_files | repository | Files in the last successful backup |
kind is the job kind, such as backup, forget, prune, check or init; restores are left out. The Go runtime and process metrics are there too.
Alerting
For example, a backup older than a day:
- alert: ResticGUIBackupTooOld
  expr: time() - resticgui_job_last_success_timestamp_seconds{kind="backup"} > 86400
  for: 1h
  annotations:
    summary: "No backup of {{ $labels.repository }} for a day"
Or a last run that failed:
- alert: ResticGUIJobFailed
  expr: resticgui_job_last_run_success == 0
Grafana dashboard
deploy/grafana/resticgui-dashboard.json shows the backups and the repositories: how many repositories there are, which jobs are failing, the age of the oldest last backup, a table with each repository's last backup, size and snapshots, and graphs of time since the last backup, run results, data added, duration, repository size and snapshot count. A Repository filter at the top narrows it to some of them.
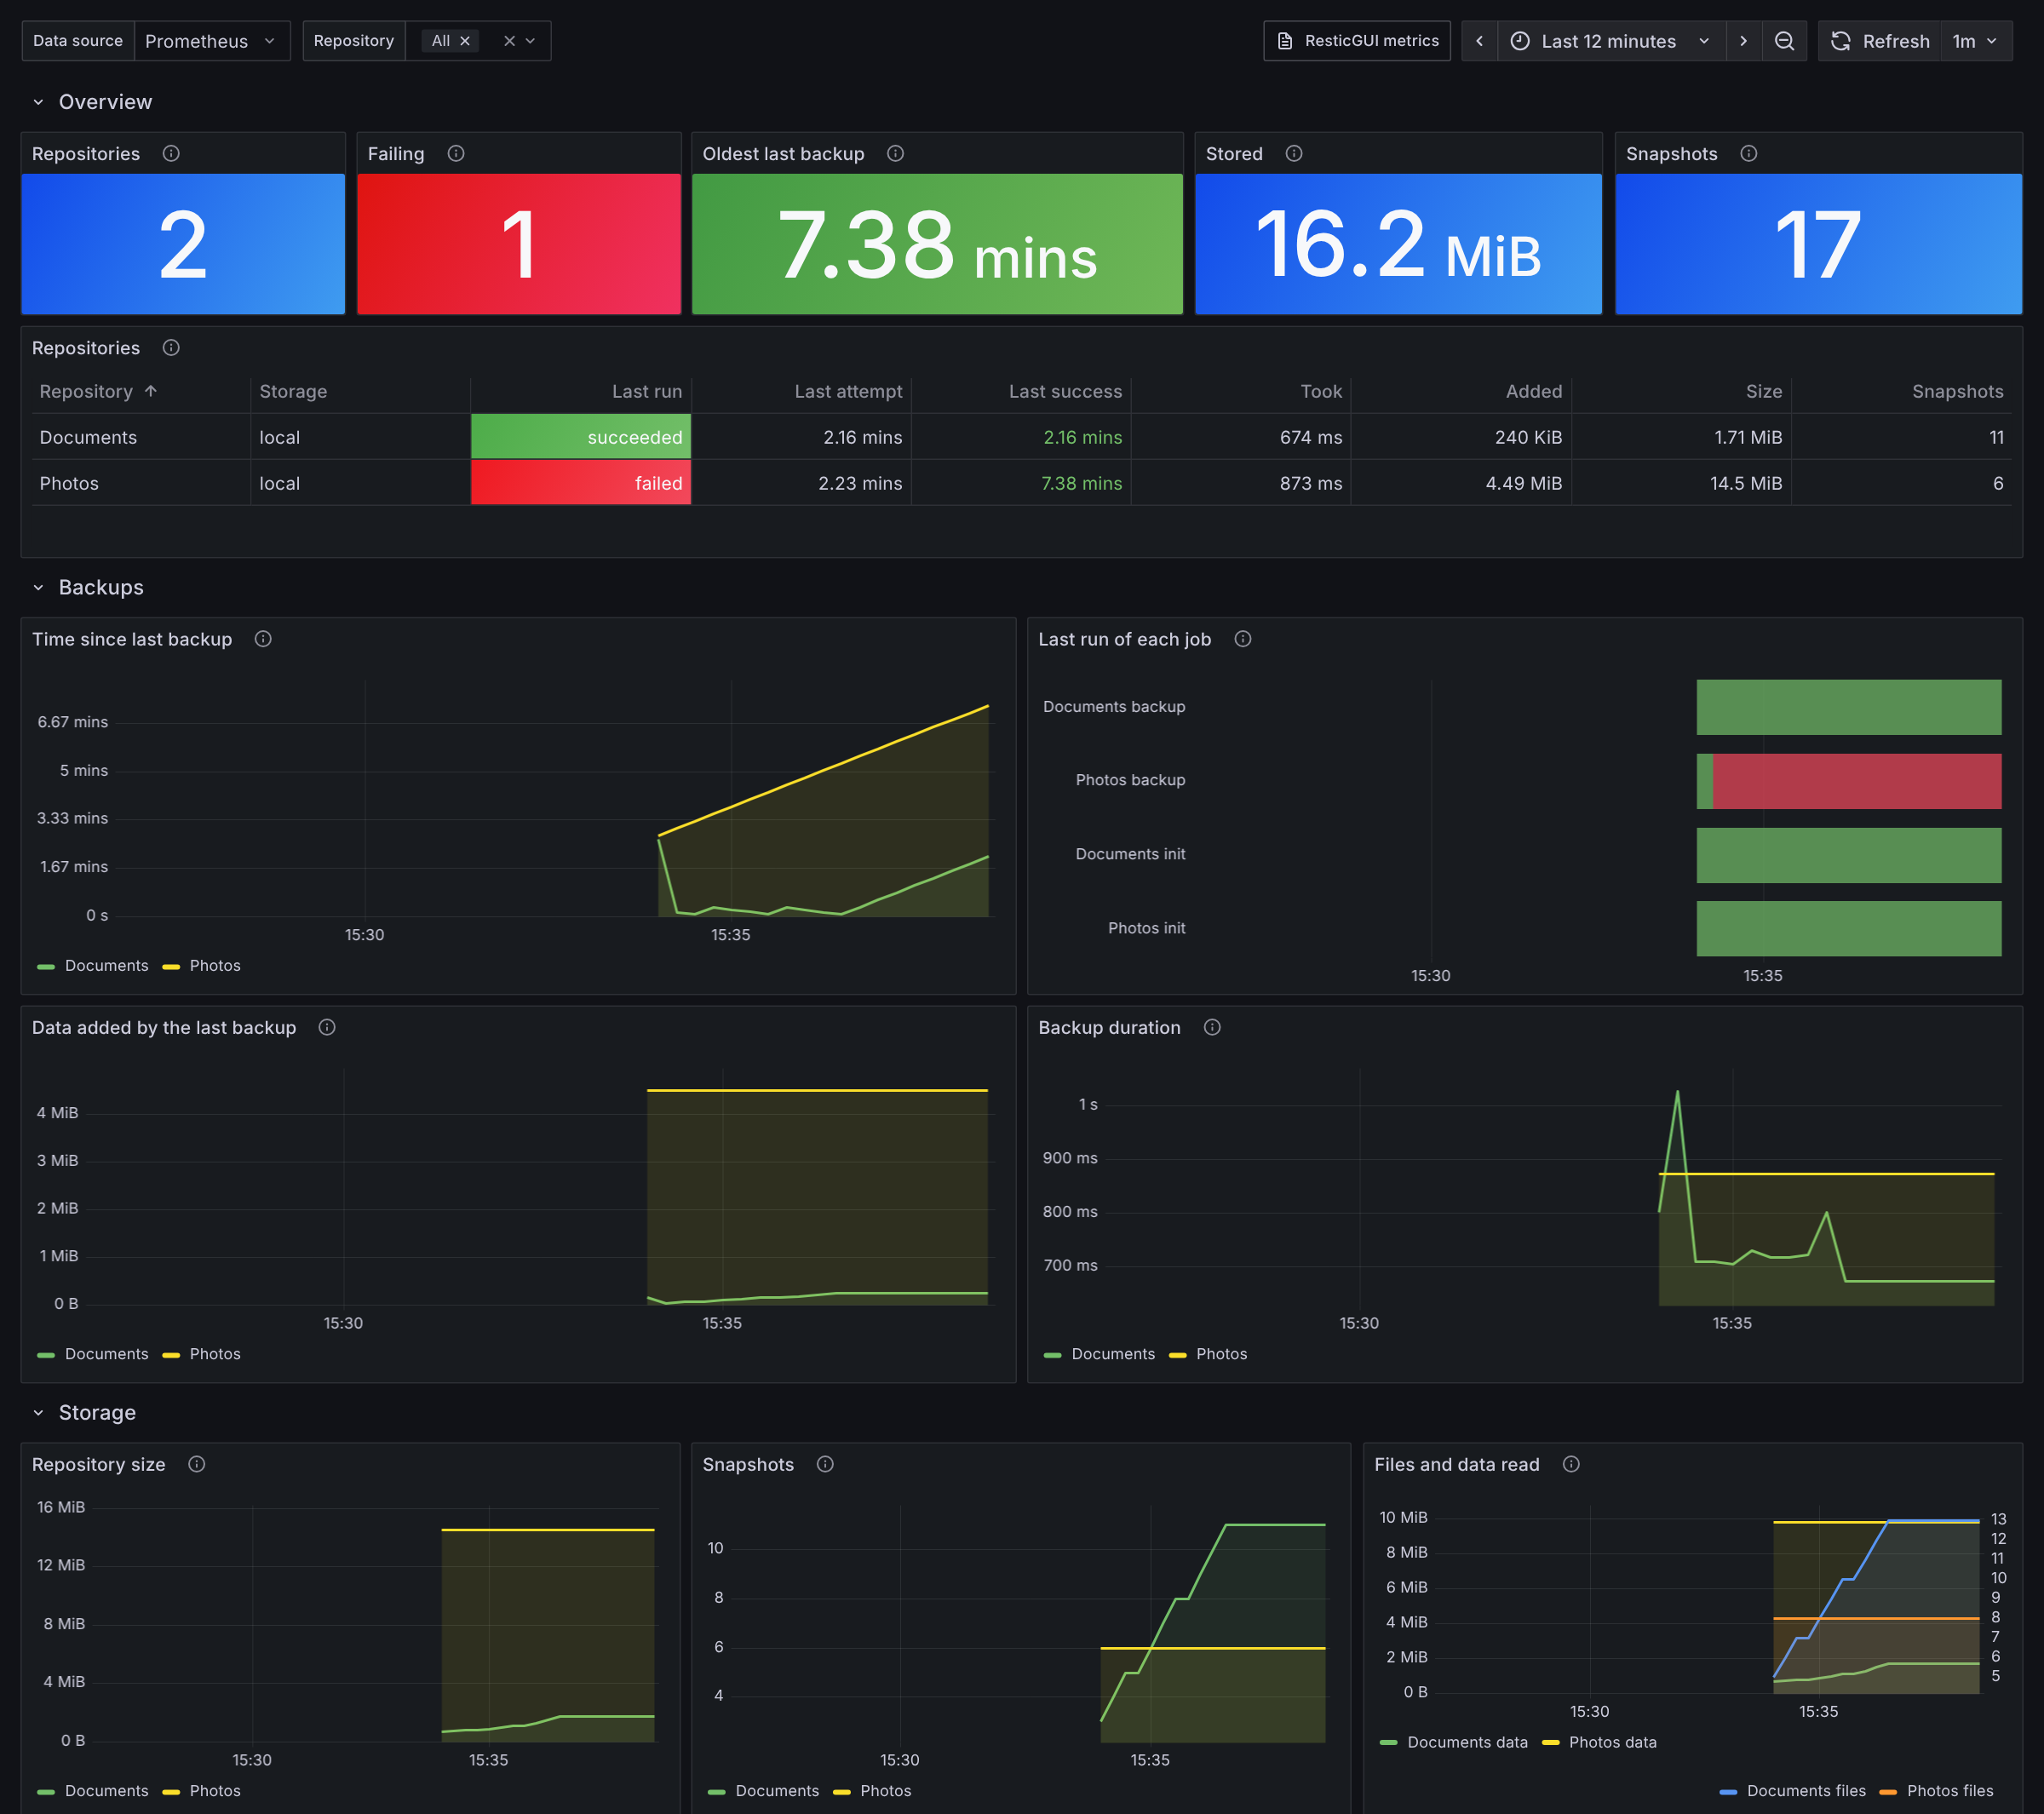
To import it, in Grafana open Dashboards, New, Import, upload the file and pick the Prometheus data source that scrapes ResticGUI. To provision it instead, put the file in a folder that a dashboard provider reads:
# /etc/grafana/provisioning/dashboards/resticgui.yaml
apiVersion: 1
providers:
  - name: resticgui
    type: file
    options:
      path: /var/lib/grafana/dashboards/resticgui
It needs Grafana 10 or later.